 BUILT BY ACCOUNTANTS
The details
are the point.
NetLedg connects everyday accounting with optional CFO planning and perishable inventory tools. Follow the product screens and worked examples to see the scope.
Try a small example yourself, watch a complete narrated tour, or look around the real screens. Fictional demonstration data throughout. No signup.
Batch work, AI, class/project reporting, portals and close books are in Business Complete · $38/month. Business is $20/month; specialist modules are separate. The narrated tours identify the current tiers. Full terms and module offers are on Pricing.
A small, hands-on example.
Change something. See what follows.
Frostline · sample companySAMPLE DATAHot honey pizza · one recipe, a clear bill of materials.
Fictional recipe. Conversion and packaging assumptions are included; overhead outside this model is not.
Explore unit economics, lot margins, dated movements and the source behind a cost.
Interactive illustration, not the production interface. Fictional data; no records are created or connected to Shopify, banks, customers or payment services. The narrated tours and real screens are one tab away.
The product screens.
The work you can follow.
BUILT BY ACCOUNTANTSNetLedg connects everyday accounting with optional CFO planning and perishable inventory tools. Follow the product screens and worked examples to see the scope.
Follow the same sample pizza order from its recipe to the contribution after making, shipping and payment fees.
Revenue is the easy number. NetLedg follows the recipe, the lot, the delivery and the fee through to what is actually left.
See how each cost is traced →Fictional worked example, not a customer result. Contribution is not net profit or a promised saving.
Three complete narrated tours inside NetLedg’s practice company. Choose your workflow, turn on sound, and jump to any chapter.
Recorded before the NetLedg rebrand; screens and narration may use the LedgerHub name.
 6:26 · 14 CHAPTERSPERISHABLE INVENTORYFrom recipe to payout. Follow the whole cycle.Watch the full tour ↗
Recorded before the NetLedg rebrand; screens and narration may use the LedgerHub name.
Current plans: Business $20; Complete $38 includes batch work, AI, class/project reports, recurring work, portals and close books. Specialist modules are separate. See pricing.
Real NetLedg practice-workspace actions and screen captures, with timed explanatory highlights, edited into chapters—not one continuous recording. Fictional data. American-English synthesized narration and captions. No real payments, customer emails or carrier bookings.
Let's follow a product all the way through LedgerHub. We'll build a recipe, buy and receive its ingredients, record the supplier bill, produce a lot, and compare freight. Then we'll move into the practice company's existing Shopify orders, payouts, fulfillment charges, and reports. This is the real LedgerHub interface, with fictional practice data. The new production example and the older sales examples are separate, so we'll keep their numbers clearly distinguished.
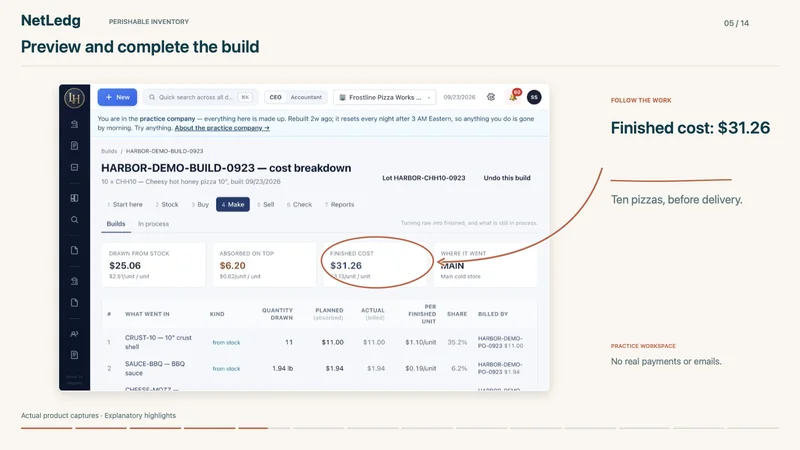
Our recipe makes ten cheesy hot honey pizzas. The bill of materials includes the crust, sauce, cheese, chicken, and packaging. We also enter forty cents per finished unit for conversion, and twenty-two cents for overhead. A recipe is more than a list of ingredients: it defines the yield and the costs that should follow the finished goods. The build preview then checks what is actually available before production.
The first build preview identified a shortage of usable ingredients. Instead of skipping that step, we created a forty-dollar practice purchase order. Notice that the purchase order tracks what we intend to buy. It is not proof that the goods have arrived, and it is not yet the supplier bill. We marked this example as sent using the no-email option. No supplier was contacted.
Next, we receive the ingredients into the main location, with separate lot references and best-by dates. Those details matter later when we trace production. Bill what arrived creates the supplier bill, and the purchase order now shows ordered, received, and billed amounts together. The forty-dollar bill remains unpaid. This is a recorded practice transaction, not a payment to a real supplier.
With usable ingredients available, the build can be priced and completed. Ten pizzas carry twenty-five dollars and six cents of consumed stock cost, plus six dollars and twenty cents of planned conversion and overhead. The total is thirty-one dollars and twenty-six cents, or three dollars and twelve point six cents per pizza. The breakdown keeps the inputs visible. Planned conversion is not yet supplier-billed, and delivery is not part of this build cost.
The finished lot now holds ten units, with its own best-by date, location, value, and production reference. We can follow the ingredients upstream into the build rather than relying only on an average product cost. That is the connection between the physical batch and the accounting evidence. This new lot is still on the shelf; the historical sales shown later are not sales of this batch.
For this practice shipment, we enter two fictional quotes: eighteen dollars for one day, or fifteen dollars for two days. We select the faster service. The comparison makes the three-dollar trade-off visible instead of treating the cheapest quote as automatically best. This is an internal quote selection. It does not contact a carrier, fetch live rates, or make an external shipping booking.
Now we switch to existing practice sales. Shopify orders and payouts have their own review steps. The queue tells us which orders need attention and which are blocked, for example by an unknown item code. An order, a payout, and a bank deposit are not three separate sales. Keeping those stages connected helps prevent duplicate revenue and makes missing steps easier to investigate. We leave the unresolved order preview unposted.
Here is an existing practice payout with two posted orders. Gross sales are ninety dollars and forty-eight cents. Fees are three dollars and eighteen cents, leaving eighty-seven dollars and thirty cents. Recording the payout creates the transfer from Shopify clearing to operating checking, with fees shown separately. The result is recorded in these practice books. Bank confirmation still says pending; we have not claimed or forced a bank match.
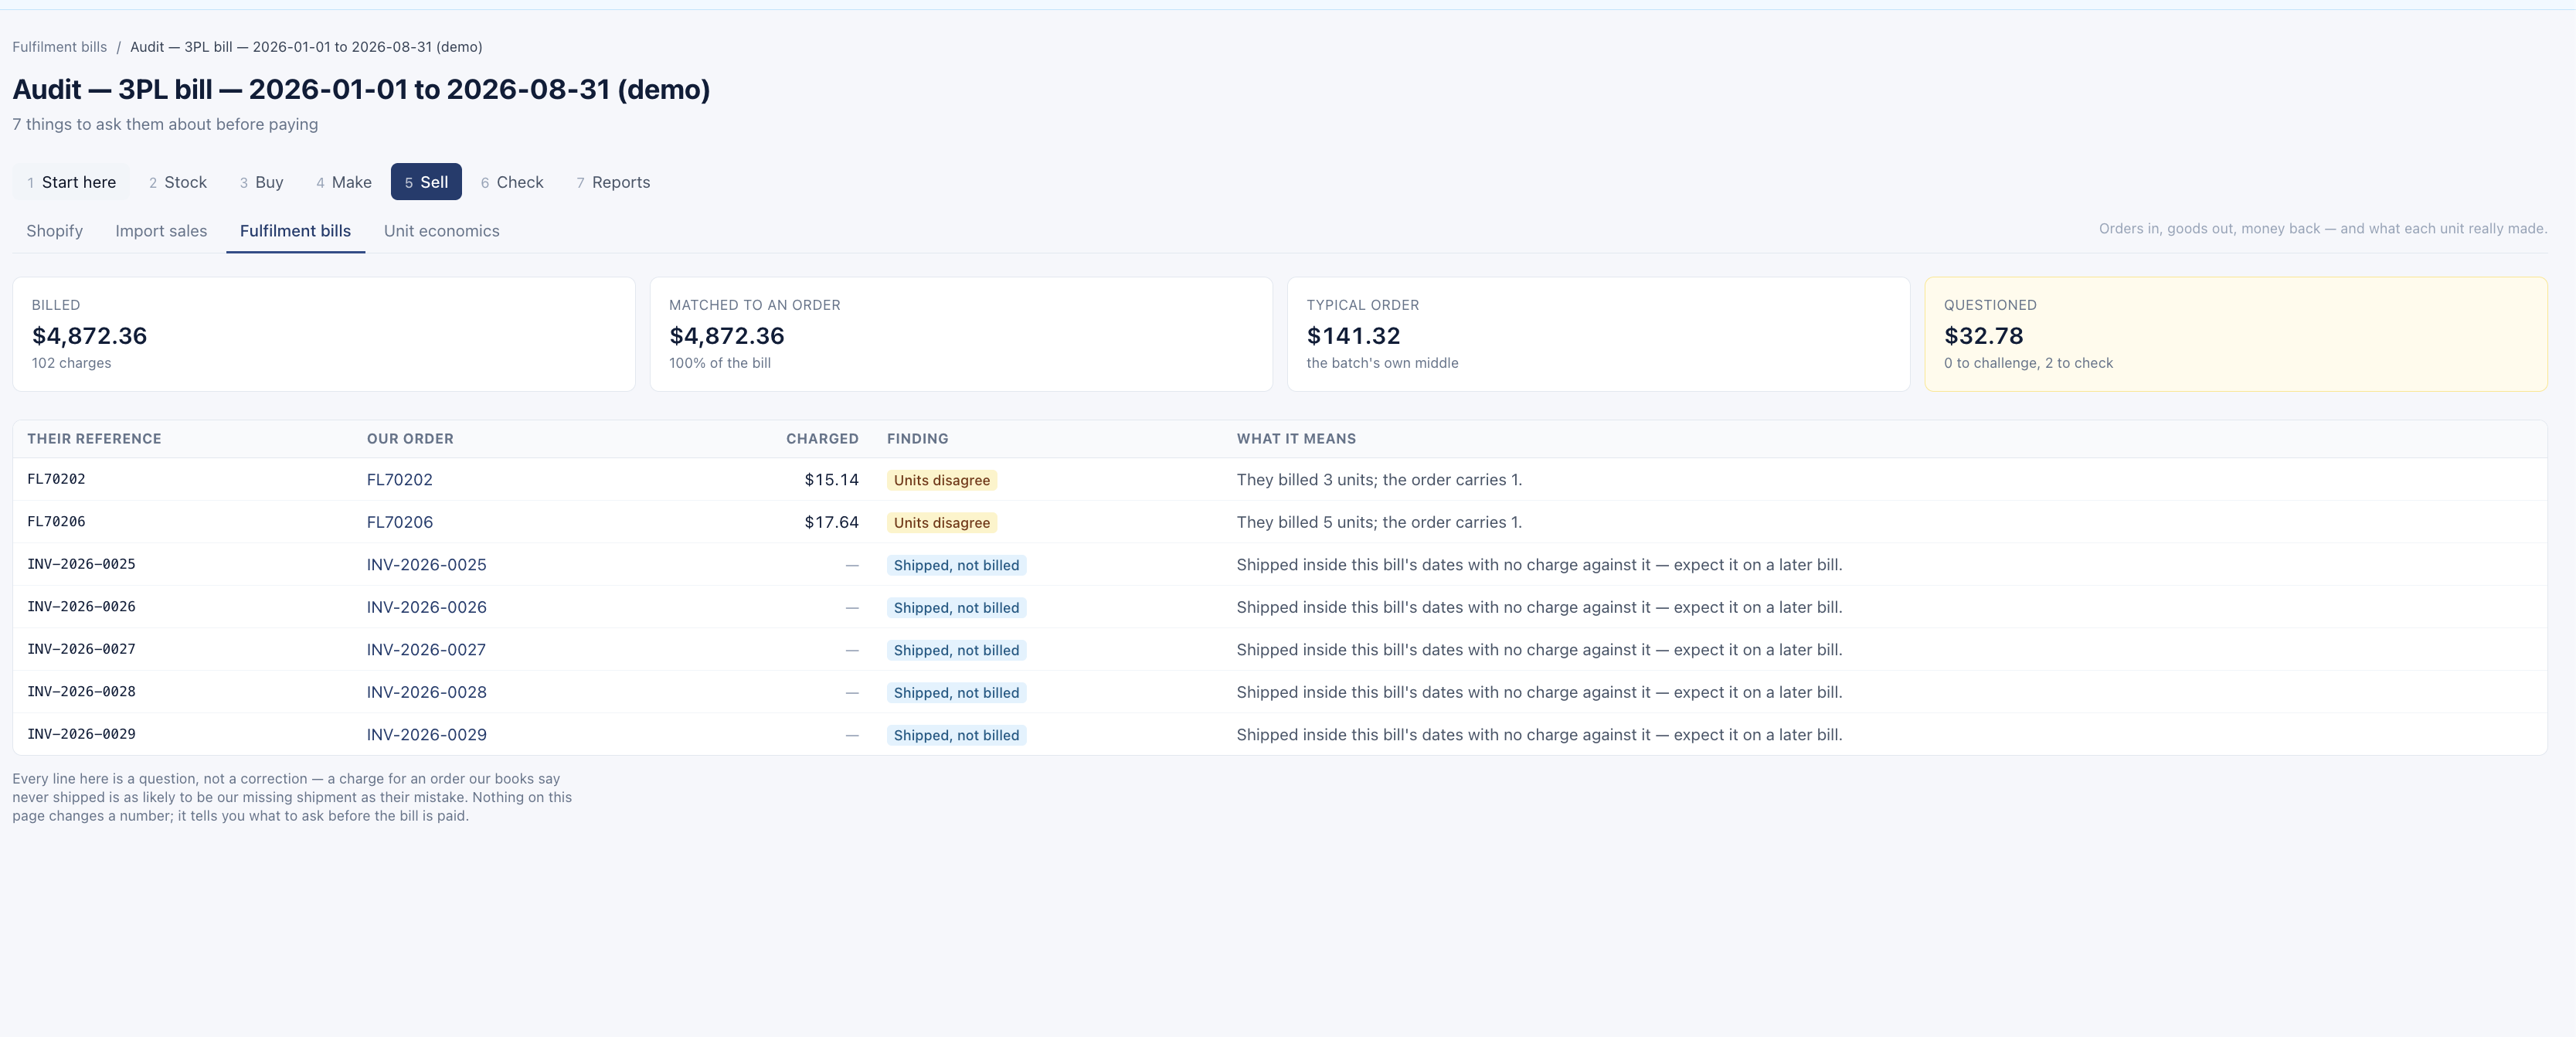
The fulfillment provider's order-level file supplies the detail behind its invoice. This existing demonstration import contains one hundred and two charges totaling four thousand eight hundred seventy-two dollars and thirty-six cents. Matched charges follow the orders they belong to; unmatched charges remain visible. The import screen accepts a CSV or Excel file and lets you review the matches before saving. In this tour, we inspect the already imported practice bill.
Opening the audit turns the bill into questions you can investigate. Here, two lines have unit counts that disagree with the orders, and five shipped orders have no charge on this bill. A flagged line is not proof of an overcharge, and the audit does not silently rewrite the books. It gives the team a specific reference and an explanation to check before deciding what should happen next.
Unit economics brings book cost, delivery cost, cost to serve, and contribution together. Actual matched fulfillment charges are labeled. Costs without an order-level charge can use an allocated estimate, with the limitation explained on the page. In this historical example, the cheesy hot honey pizza shows a strong book margin, but a much smaller contribution after delivery. The lot-level view goes deeper, because different production batches can carry different costs.
The expiry board combines a deadline with the recent selling pace. It highlights stock that may still be on the shelf when its best-by date arrives. This is a planning signal, not a guarantee and not an automatic markdown. What to order adds stock cover and lead-time context. Missing lead times and lumpy sales are called out, so a precise-looking number does not hide a weak assumption.
Search inventory in Reports to bring the report set together: stock roll-forward, valuation, stock on hand, lot trace, expiry, work in process, production, added costs, purchasing, and shipping economics. Perishable Inventory is optional with either Business or Complete. Its regular monthly price is seventy-nine ninety-nine per company, plus the base subscription, before tax. Standard inventory stays included in both business tiers. Monthly plans can be cancelled; annual plans prepay a twelve-month term. See Pricing for module offers, eligibility and renewal amounts.
 4:07 · 9 CHAPTERSCFO SUITEChange an assumption. See the financial impact.Watch the full tour ↗
Recorded before the NetLedg rebrand; screens and narration may use the LedgerHub name.
Current plans: Business $20; Complete $38 includes batch work, AI, class/project reports, recurring work, portals and close books. Specialist modules are separate. See pricing.
Real NetLedg practice-workspace actions and screen captures, with timed explanatory highlights, edited into chapters—not one continuous recording. Fictional data. American-English synthesized narration and captions. No real payments, customer emails or carrier bookings.
CFO Suite starts with a practical question: what needs our attention next? This is the real LedgerHub practice workspace. Its priorities link the cash outlook to the underlying books, receivables, and payment timing. We are looking at fictional data, not a promise about a real company's future. A forecast is useful when the assumptions and limits are visible alongside the number.
Planning and Review brings the operating plan, projected cash, statements, and follow-ups into one place. The opening period is stated, and readiness checks show where the evidence still needs attention. In this example, the month-end plan has a cash shortfall and no protected cash reserve has been set. Those are questions to resolve, not details to hide behind a reassuring chart.
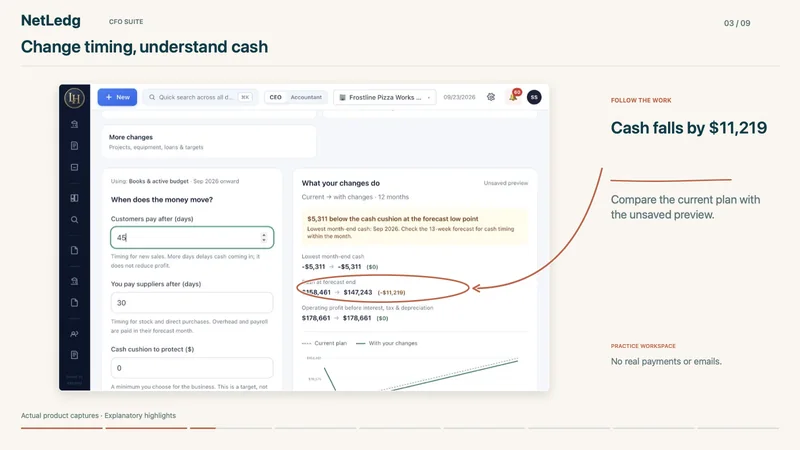
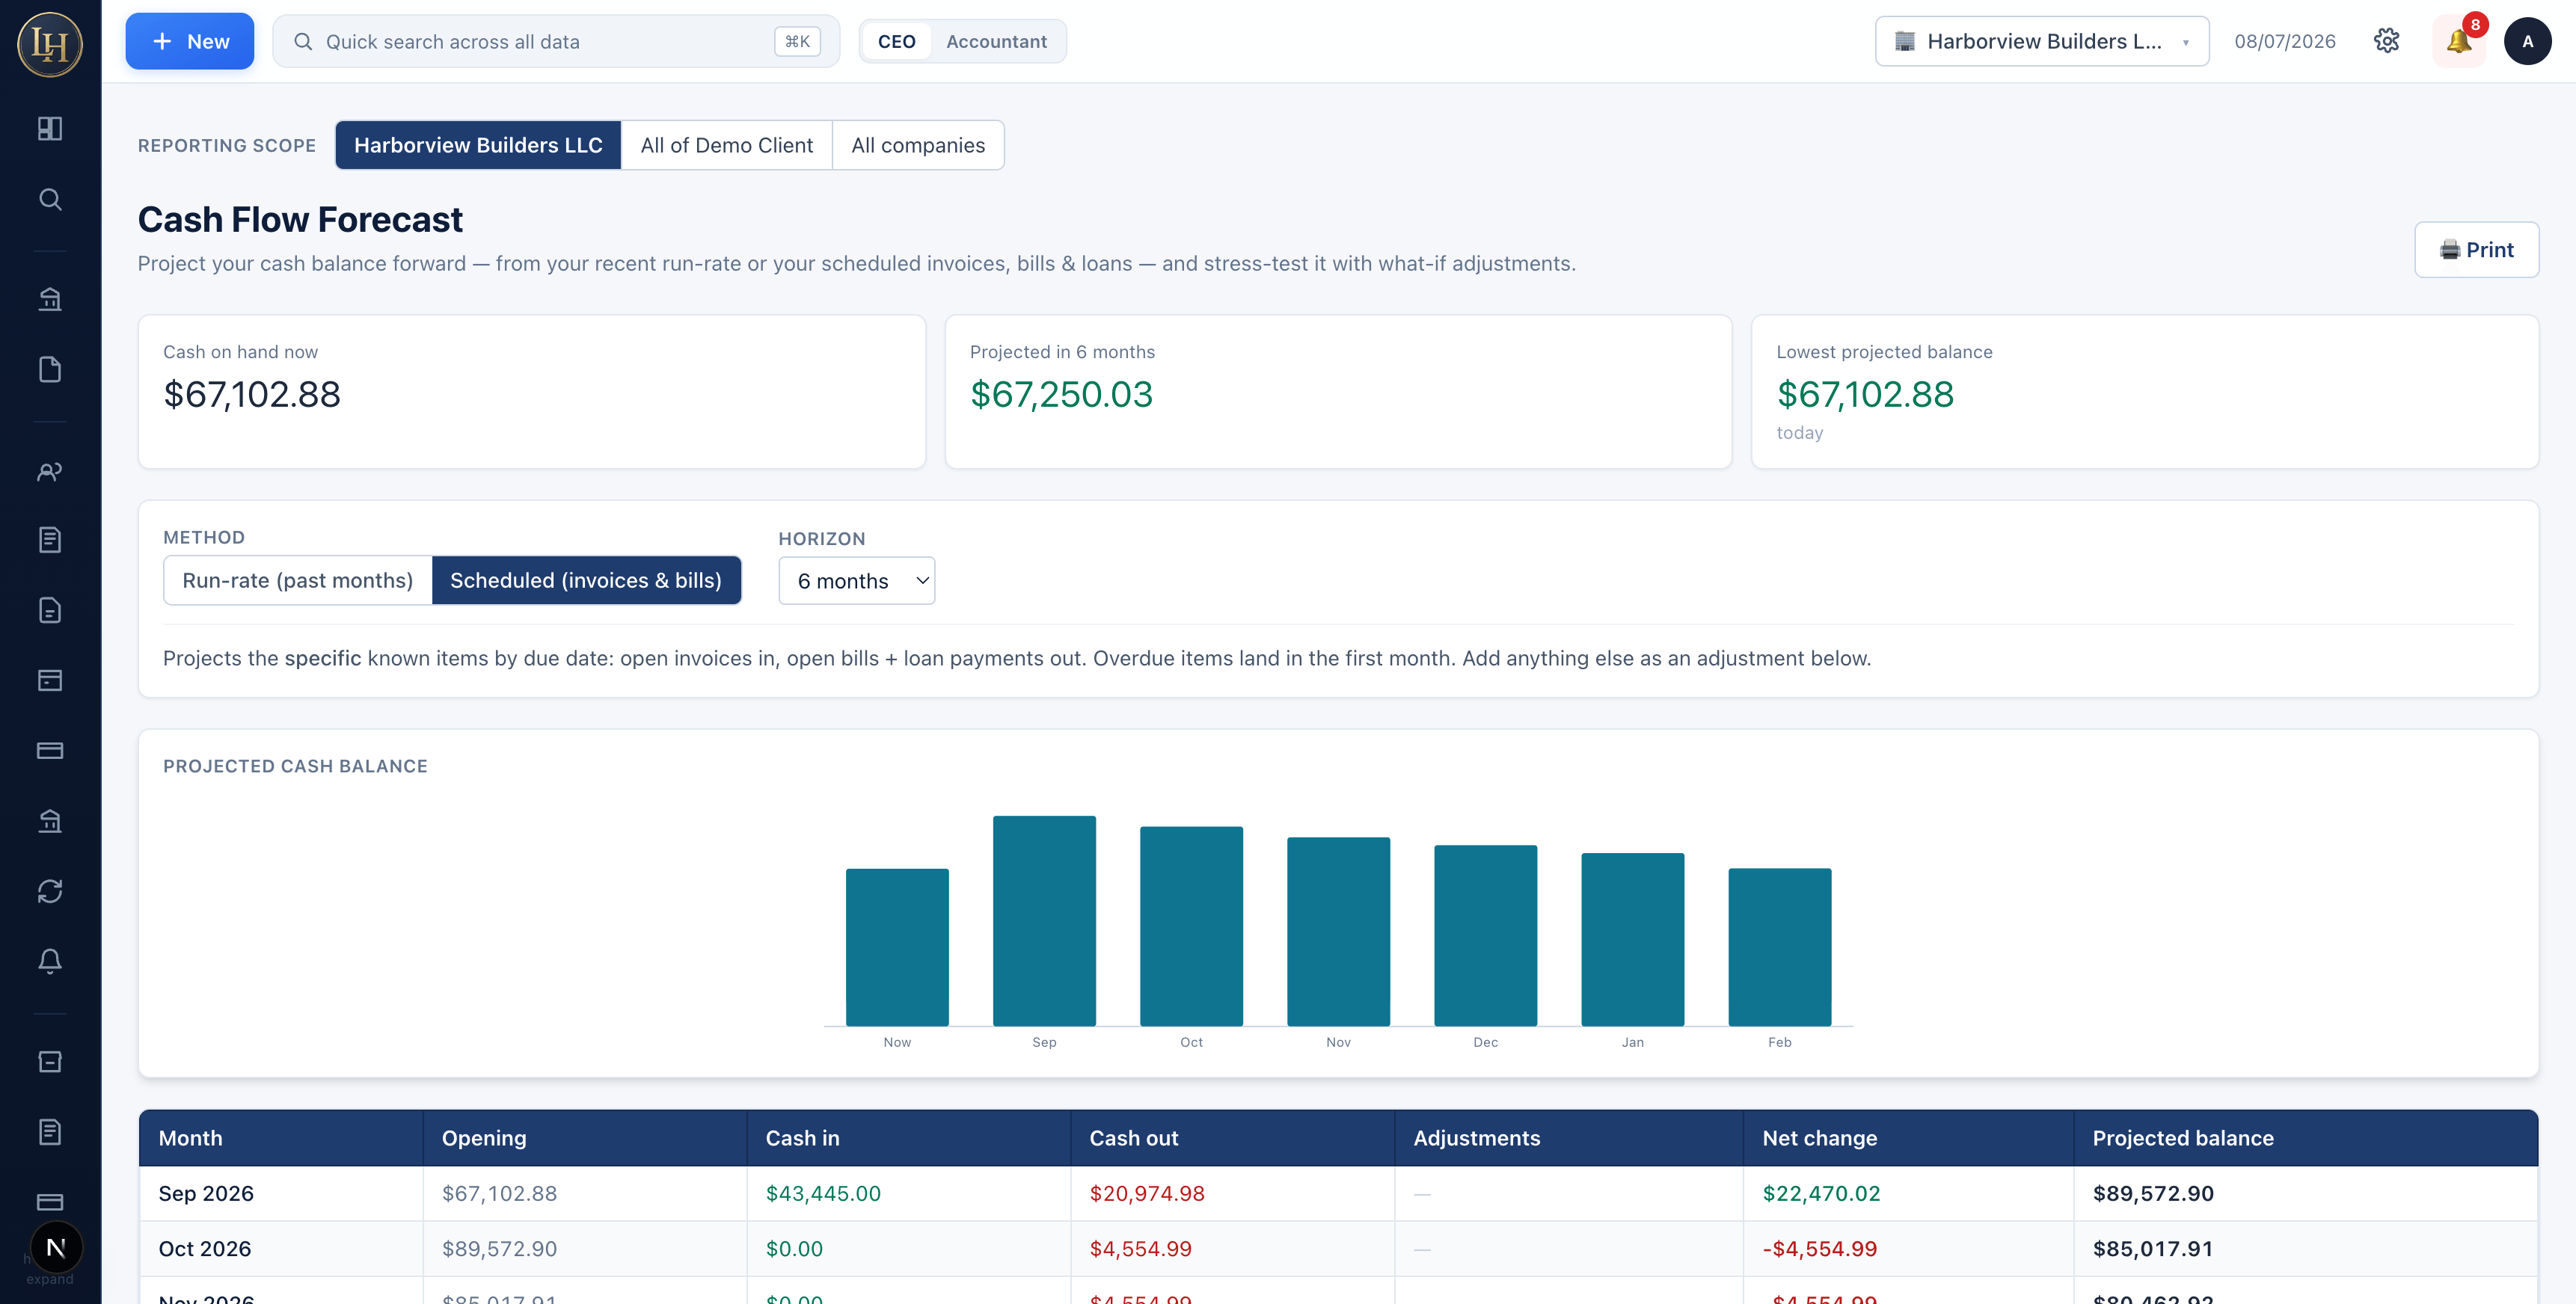
Let's change one assumption: customers pay after forty-five days instead of thirty. The unsaved preview lowers cash at the forecast end by about eleven thousand two hundred nineteen dollars. Operating profit does not change, because collecting later changes timing, not the amount earned. The original input is restored after this demonstration. No experiment is posted to the ledger or saved as the company's agreed plan.
The Statements view follows the same plan into profit and loss, the balance sheet, and cash flow. That connection helps you see whether an attractive profit forecast also produces enough cash and how the balance sheet changes along the way. Values on screen can be rounded for readability while calculations retain cents. Always review the source assumptions before relying on the result.
Reviews is where a team can keep a dated copy and later compare it with closed actual results. Readiness checks include the opening statements, close date, bank reconciliations, uncategorized transactions, and feed status. Our practice example still needs reconciliation and close-date review. We show those gaps honestly. A saved forecast should preserve what was known at the time, not quietly change after the discussion.
The rolling forecast can extend from twelve to eighteen months. Its legend distinguishes schedules, budgets, detected patterns, prior-year comparisons, and run rates. Coverage and confidence are visible on the page, along with an uncertainty band. Extending the horizon is useful for planning, but it does not make the later months certain. For near-term payment pressure, switch to the weekly view.
A ratio should not be a mystery number. Opening Current ratio reveals the current assets and liabilities behind it, links to supporting reports, and a five-period trend. The same approach helps you inspect liquidity, profitability, leverage, and cash measures. Where the books cannot support a calculation, the product explains the limitation rather than presenting an unavailable result as zero.
A month-end forecast can miss a tight week in the middle. The thirteen-week cash view brings known schedules, recurring activity, and other modeled amounts onto a weekly timeline. It also identifies receivables that are not counted as reliable inflows. Review those exclusions and timing assumptions before committing cash. This is planning evidence, not a guarantee that a customer will pay.
The monthly report brings the period into a readable review, with changes, cash context and actions to consider. The suite also includes scenarios, debt and covenant tools, consolidation where configured, and tax-distribution planning inputs. Availability depends on company setup. CFO Suite is software, not a human advisory service. It is optional with Business or Complete at a regular forty-nine ninety-nine per company per month, plus the base subscription, before tax. Monthly plans can be cancelled; annual plans prepay a twelve-month term. See Pricing for module offers and renewals. Forecasts and planning tools are not financial or tax advice.
 4:53 · 10 CHAPTERSNETLEDG BUSINESSFrom the first question to the month-end close.Watch the full tour ↗
Recorded before the NetLedg rebrand; screens and narration may use the LedgerHub name.
Current plans: Business $20; Complete $38 includes batch work, AI, class/project reports, recurring work, portals and close books. Specialist modules are separate. See pricing.
Real NetLedg practice-workspace actions and screen captures, with timed explanatory highlights, edited into chapters—not one continuous recording. Fictional data. American-English synthesized narration and captions. No real payments, customer emails or carrier bookings.
Welcome to LedgerHub Business and Complete. This is the real interface inside Frostline Pizza Works, a fictional practice company. Receivables, payables, cash, sales, and the work needing attention belong to one workspace. Business covers everyday bookkeeping, standard inventory, loans and customer profitability for twenty dollars per company per month. Complete adds batch work, AI, class and project reporting, and close controls for thirty-eight dollars. We'll show both tiers and identify the differences. Optional specialist modules are separate.
Ask your books, included in Complete, lets us put a question in plain English. Here we asked about August revenue, cost of goods sold, and net profit. The response gives the numbers, but flags that no operating expenses were posted for that month. That is a prompt to check for missing payroll, rent, or other costs before interpreting the margin. AI helps you investigate; you still need to review the underlying books.
CFO Insights brings revenue, gross margin, net profit, spendable cash, receivables, and payables into a financial overview. Change the period or reporting basis and follow the linked figures into reports. This overview is distinct from the optional CFO Suite, which adds the deeper planning, forecast, scenario, and review tools shown in its own tour. You can understand today's performance without confusing it with a prediction.
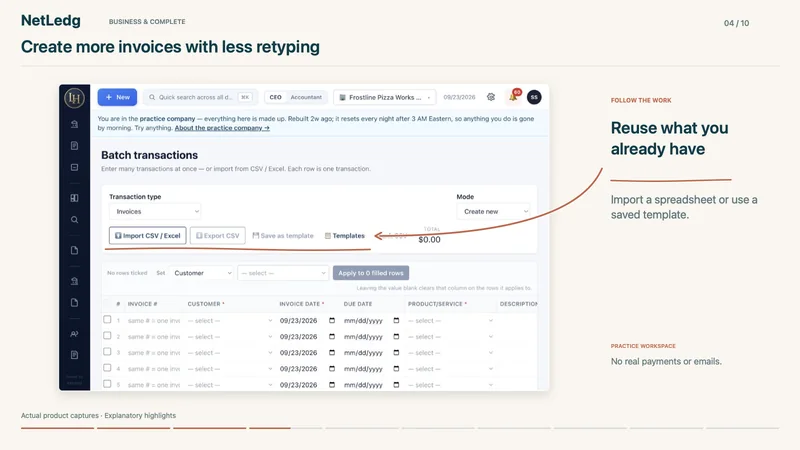
Batch transactions, included in Complete, brings repeated work into a single grid. Choose invoices, bills, expenses, or sales receipts. For invoices, repeated invoice numbers group lines into the same document. CSV and Excel import, shared-value controls, and reusable templates help reduce re-entry. Required fields remain visible. This is the real create-new mode: empty rows are skipped, and nothing is committed until the save step.
In Complete, switch to Modify existing and load invoices into the grid. The practice example brings existing lines together for review. Shared values can be applied to selected rows, and the update action states how many invoices it affects. Fields without a grid column are preserved. Paid or closed-period corrections require an additional reason. Here we load the data without making a bulk update or sending invoices.
Bank rules describe what should match and what should happen next. Conditions can use the description or amount, with all or any conditions required. Priority determines which active rule wins. Auto-apply is an explicit choice; it is not enabled in our example. The practice company has no live bank connection or saved rules, so we show the real setup form without connecting a financial account or saving a new rule.
The loan workspace supports standard level payments and custom contract schedules. Setup includes the principal, rate, term, payment frequency, and the liability and interest accounts. An already-on-the-books option avoids creating a new opening entry for history that is already recorded. This practice company has no loans configured. We are showing the actual setup controls, not a completed loan, a lending offer, or a transfer of money.
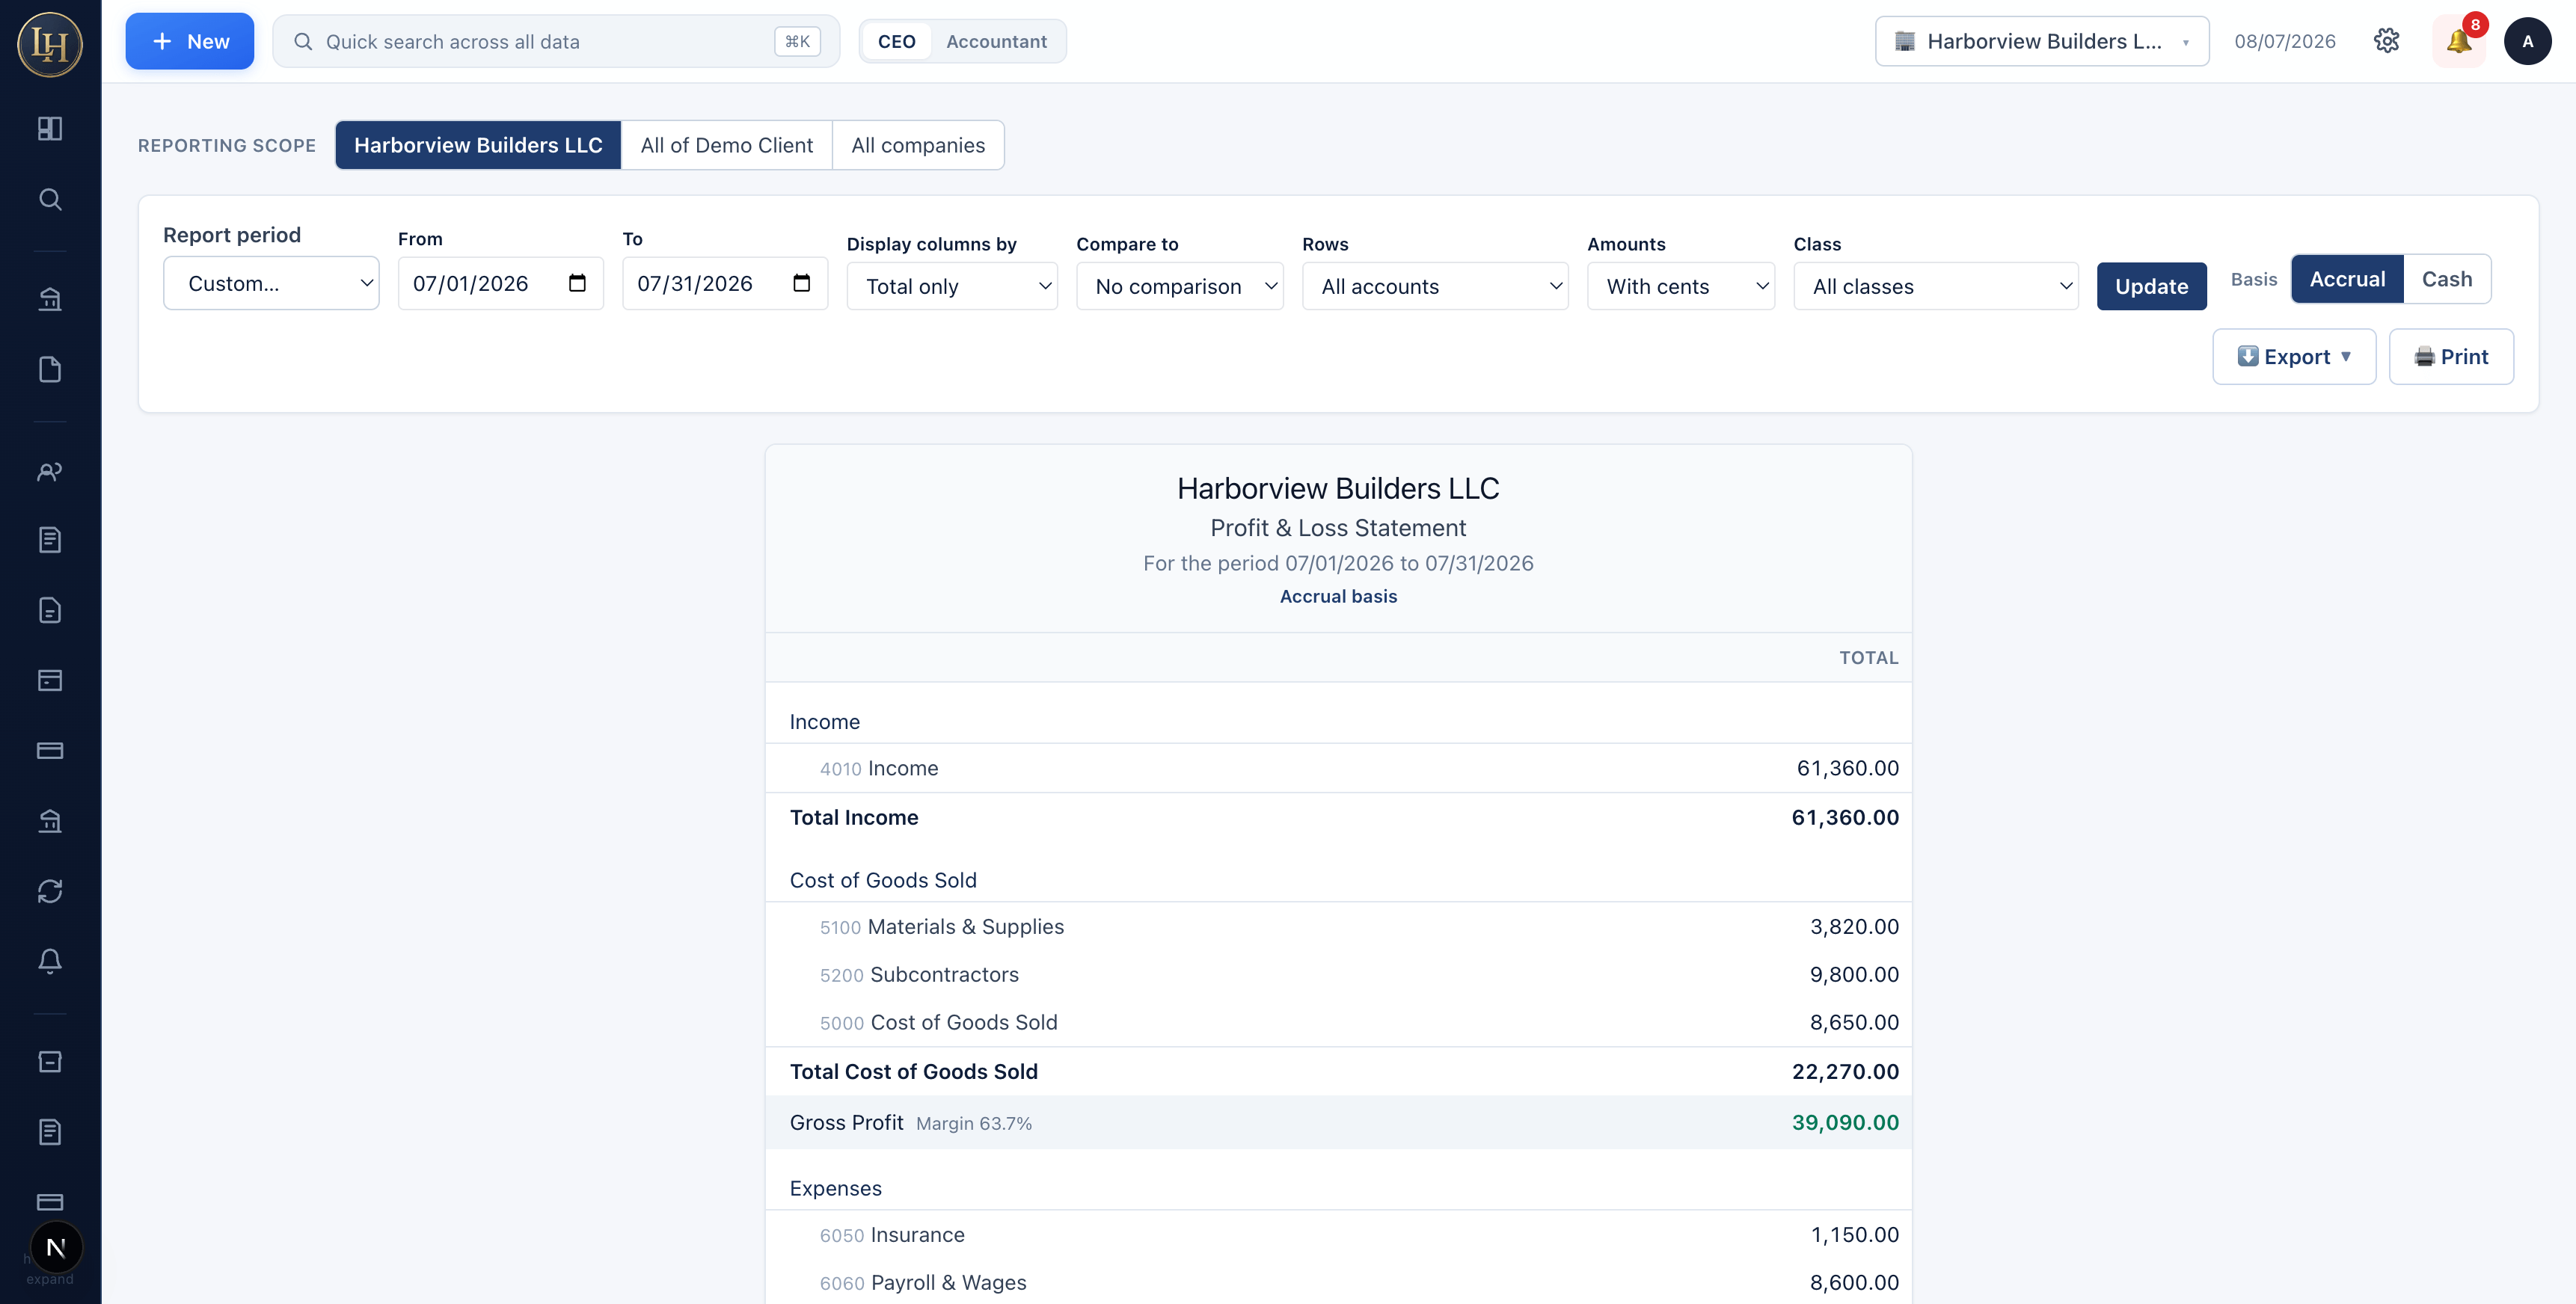
Business includes customer profit and loss alongside the company financial statements. Complete adds class and project reporting. Profit and loss by class attributes activity to departments or cost centers and reconciles to the company total. Untagged activity stays visible as Not specified. Our practice example has no class assignments, so that is exactly what it shows. The report does not invent a departmental split where source transactions have none.
Close the books, included in Complete, sets a cutoff for posting changes while reports remain available. Reopening requires a reason and is recorded in the history. The practice books stay open throughout this demonstration. Closing a period is a deliberate accounting control; here we show the controls without changing the books.
Choose Business for everyday bookkeeping, standard inventory, loans and customer profitability at twenty dollars per company per month. Choose Complete at thirty-eight dollars for batch work and the additional controls shown here. CFO Suite adds forty-nine ninety-nine, and Perishable Inventory adds seventy-nine ninety-nine, with either business tier. These are regular monthly prices in US dollars before tax. Monthly plans can be cancelled; annual plans prepay a twelve-month term. See Pricing for current module offers, eligibility and renewal amounts.
Business starts at $20. Batch work, AI, class/project reporting, portals and close books require Complete at $38. CFO Suite and Perishable Inventory are separate optional add-ons.
Explore the real NetLedg interface. Choose the workflow you care about, then see how the work comes together.
Recorded before the NetLedg rebrand; screens and narration may use the LedgerHub name.
Looking for the inventory screens? Open the real unit economics screen ↗ or see Shopify, fulfillment, shipment audit and reports →
Ask your books, work through invoices in batches, and keep every company on its own books.
Explore my business setup →See the features ↗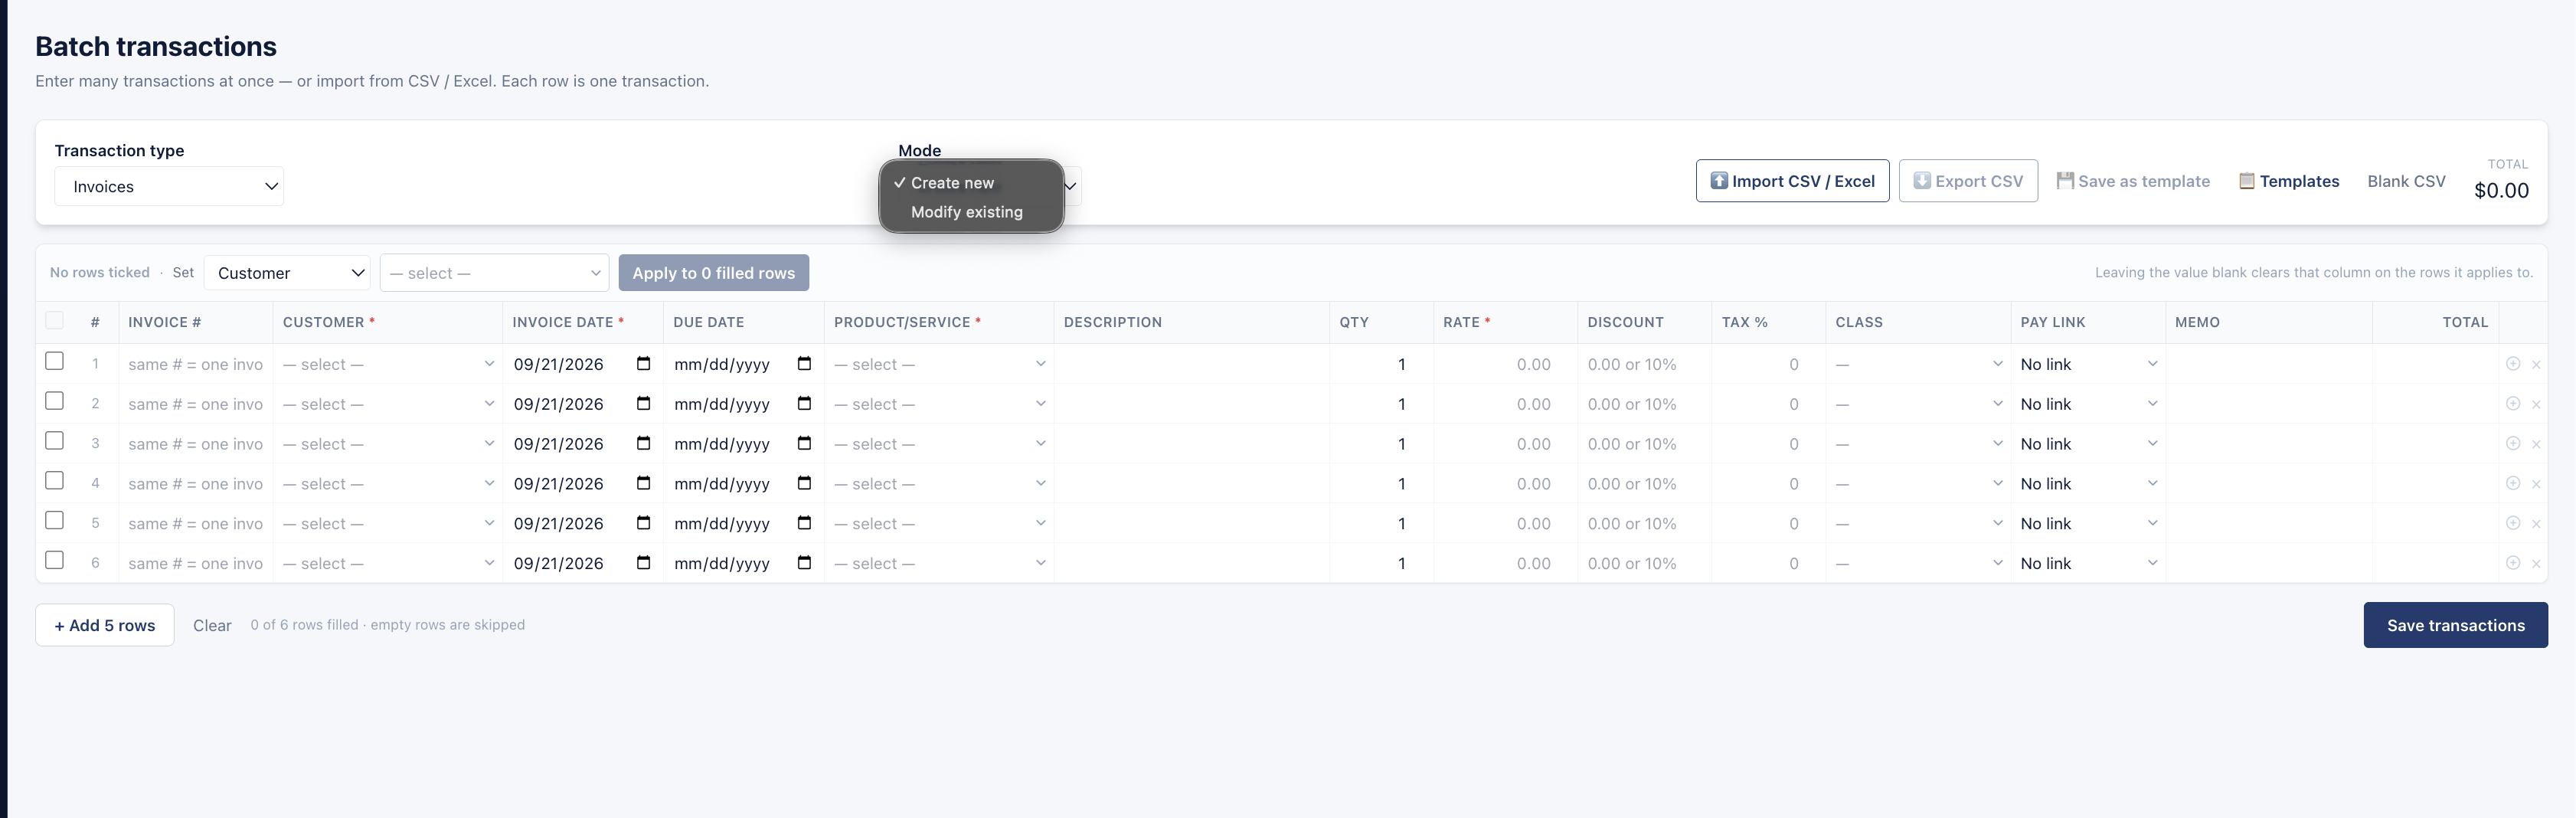
Choose a connection. See the real work behind it.
Real tools for the work between the numbers.
Explore a little. See the difference.
Try a real example from our fictional practice company.
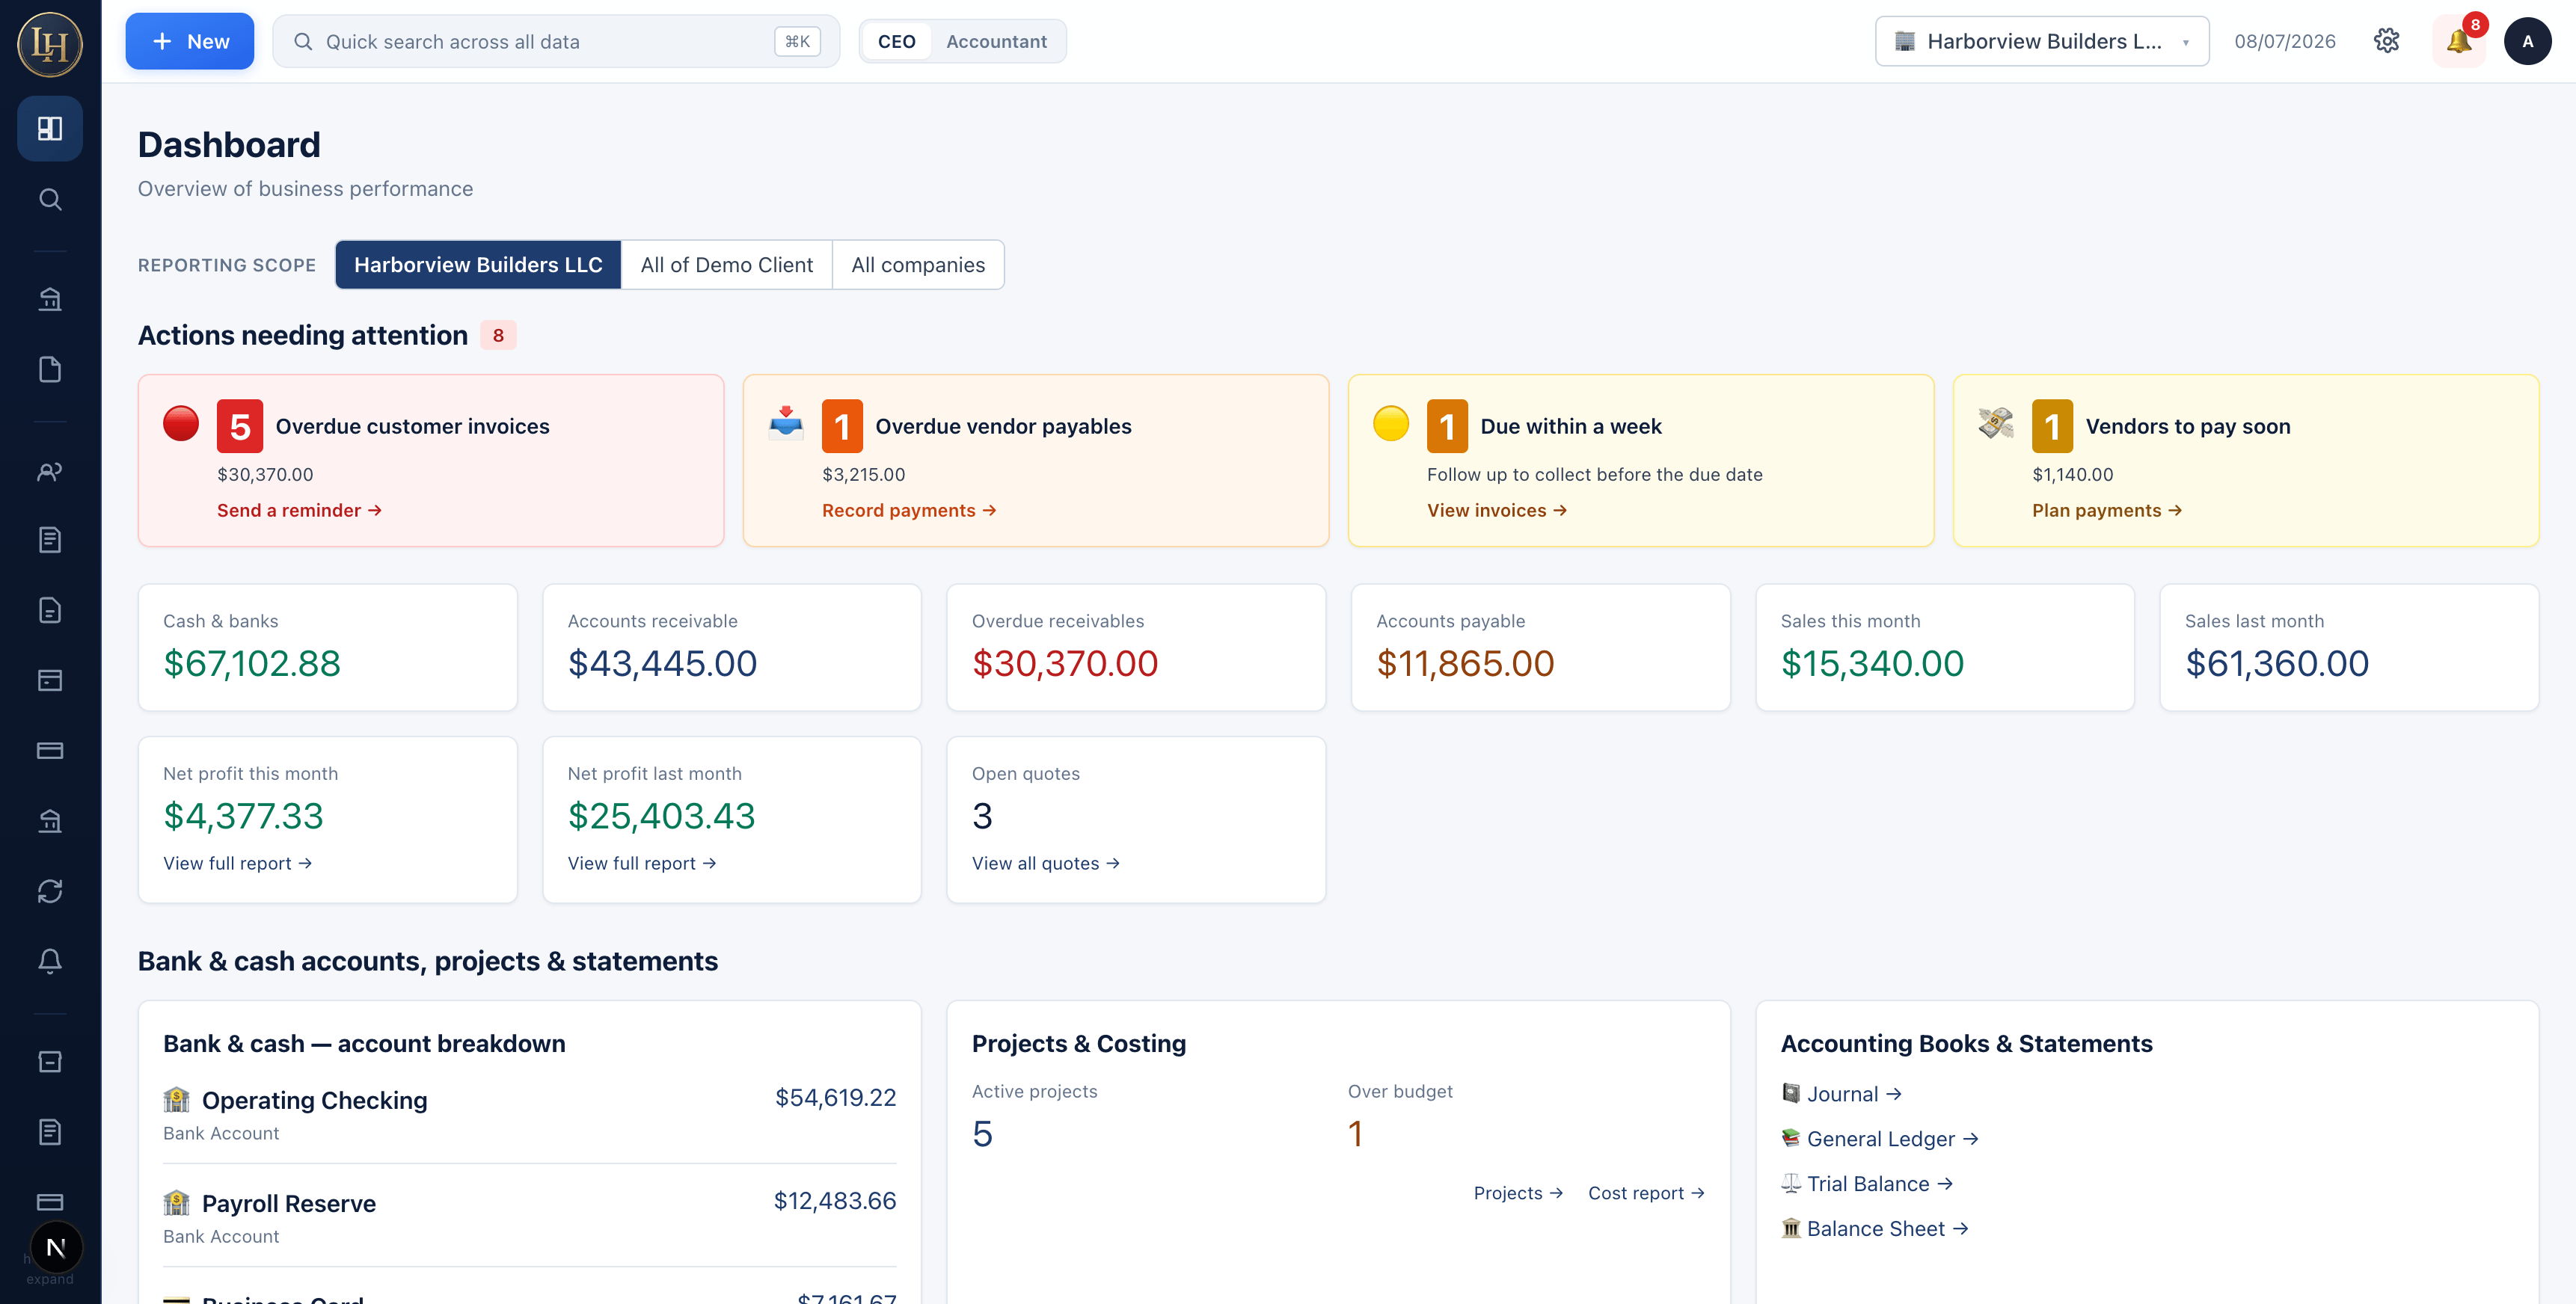
COGS: $7,449.44. No operating expenses were posted—check for missing expenses before relying on that margin.
View the actual answer ↗Create, modify and import invoices in one grid.
AI-assisted coding, reusable bank rules and reconciliation.
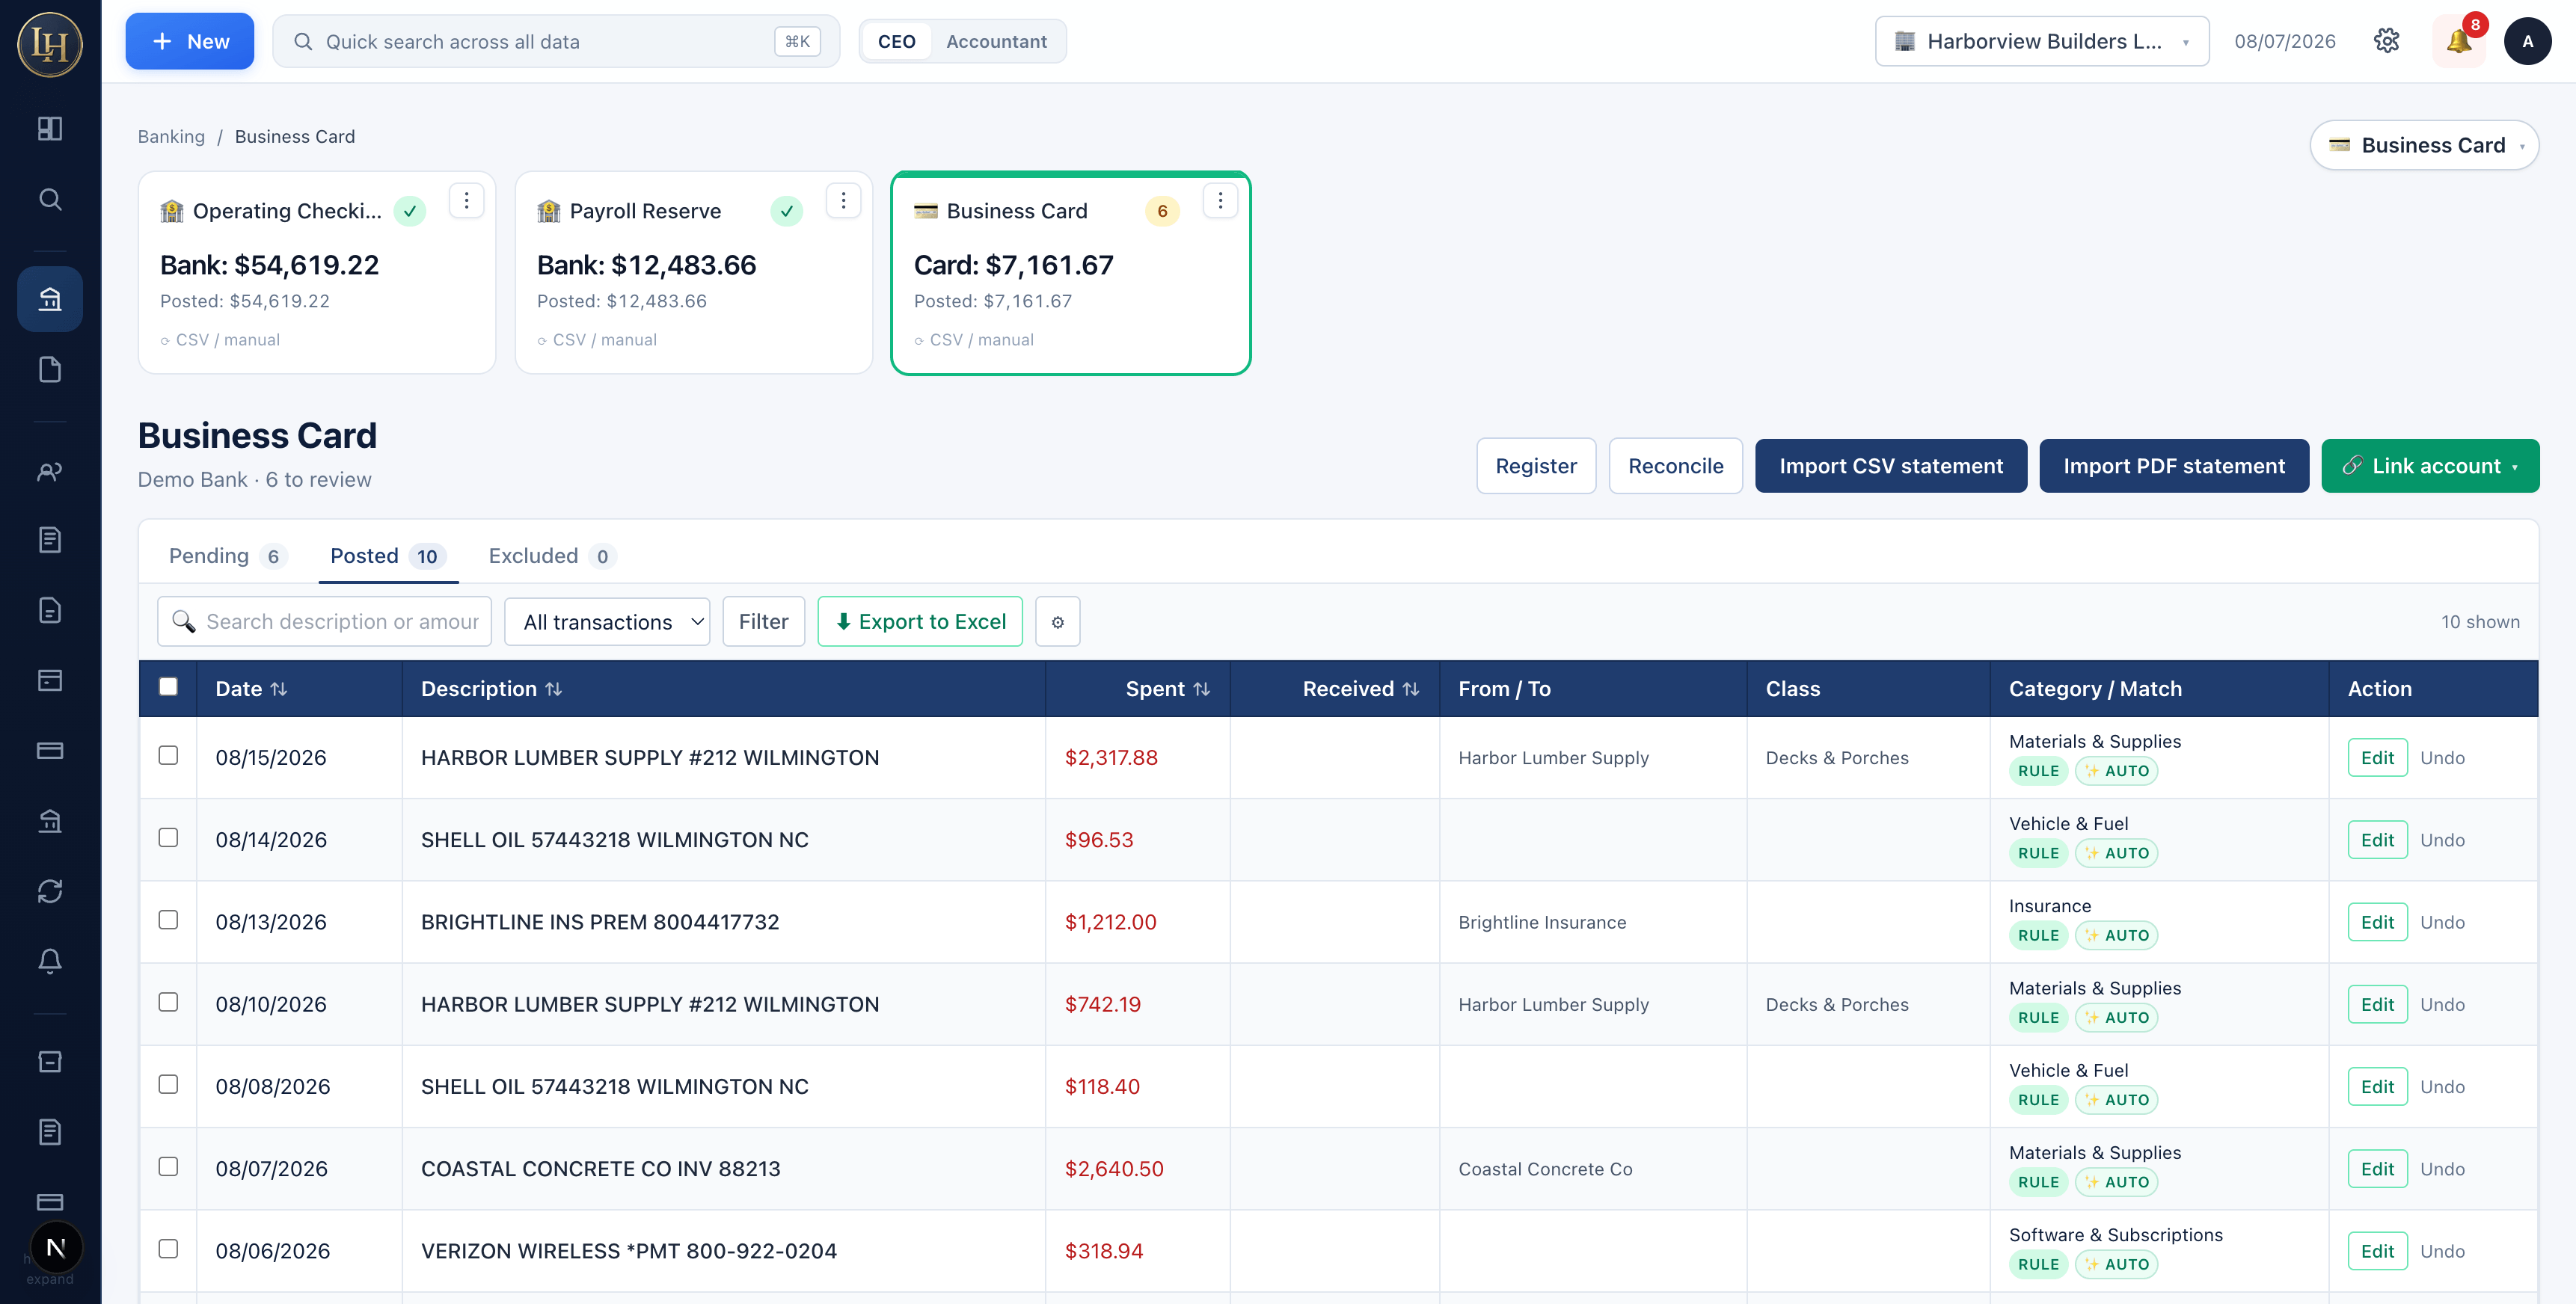
Statements and multi-class reporting for a closer look.
Forecasts, scenarios and the financial working behind them.
Recipes, lots, fulfillment costs and shipment checks.
Pick a stage. Follow the operational and financial story.
Ingredients, packaging, conversion and overhead—all part of the recipe. Scale the bill of materials to the production run.
A recipe, not just a stock count.Explore Perishable Inventory ↗Actual practice screens. The new build and historical sales illustrate different stages—not a single traced order.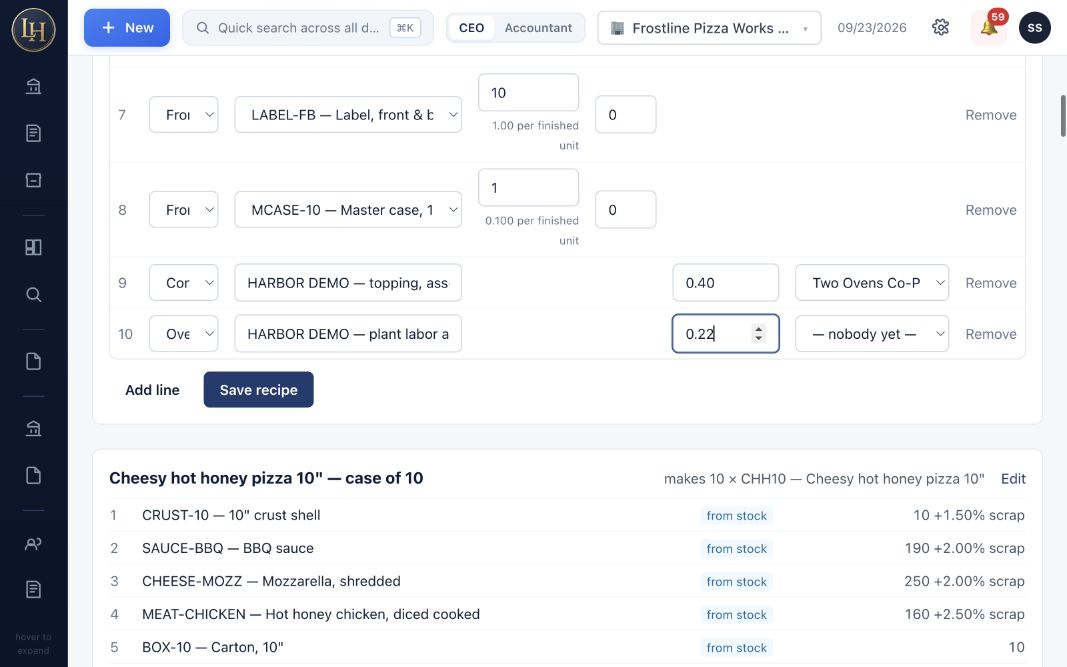 REAL NetLedg SCREEN · TAP TO ENLARGE ↗